Did you track the right metrics to truly understand your performance?
More importantly, are you using those insights to prepare for the next big sales?
Many e-commerce businesses only look at topline numbers like total revenue and orders. However, the most successful online sellers dig deeper into comprehensive metrics that pinpoint areas for optimization and new opportunities.
In this post, we’ll share some of the key e-commerce metrics top performers use. Let’s dive in!
Core Sales Metrics
Sales Conversion Rate
This metric measures the percentage of website visitors who make a purchase.
Conversion Rate = Number of Orders/Number of Website Visitors×100%
A high conversion rate indicates effective sales funnels and optimized product pages. Investigate sudden drops or spikes to identify issues or opportunities.
Monitor conversion rates for different product categories. If the rate drops suddenly, investigate whether the checkout process is too complex or if the product descriptions need improvement.
Average Order Value (AOV)
AOV represents the average amount spent by a customer per order.
AOV = Total Revenue/Number of Orders
Higher AOV means customers are spending more per order.
Optimize pricing, upselling, and cross-selling strategies. Aim to make customers buy multiple items in one order. Run promotions like “Buy 2, Get 1 Free” to increase AOV.
Shopping Cart Abandonment Rate
This metric reveals the percentage of visitors who add items to their cart but don’t complete the purchase. Reducing abandonment improves revenue.
High abandonment rates signal potential issues in the checkout process.
Calculation:
1. Manual calculation:
– Decide on the period you want to analyze, such as a week, month, or specific campaign.
– You’ll need two data points:
a. Total number of completed purchases within the timeframe.
b. Total number of shopping carts created during the same timeframe.
– Apply the formula:
Abandonment rate = (1 – (Completed Purchases / Total Carts Created)) * 100%
For example, if you had 100 completed purchases and 350 carts created, the abandonment rate would be:
Abandonment rate = (1 – (100 / 350)) * 100% = 71.4%
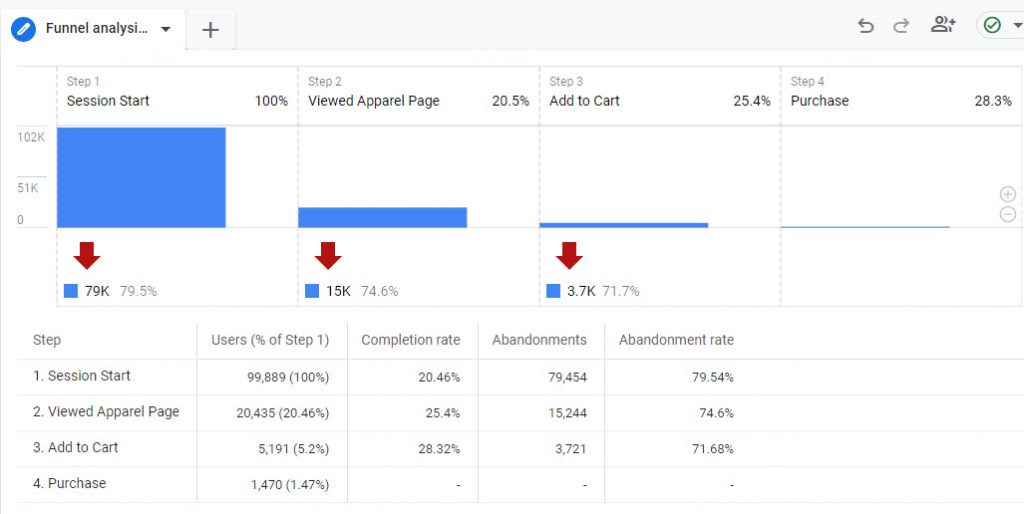
2. Using analytics software:
Most ecommerce platforms and analytics tools like Google Analytics have built-in features to track cart abandonment rates. This saves you the trouble of manual calculations and often provides additional insights into abandonment behavior.
Souce: Online Metrics
Here are some tips for you:
- Industry benchmarks can provide context for your abandonment rate. The average rate can vary depending on your industry, but generally falls between 60% and 80%. A lower rate is better.
- Consider segmenting your data to see if abandonment rates differ across product categories, device types, or customer demographics. This can help you identify areas for improvement.
- Optimize the checkout process, offer incentives (like free shipping), or send abandoned cart reminder emails.
Customer Metrics
Customer Lifetime Value (CLV)
CLV estimates the total revenue a customer generates during their entire relationship with your brand. It guides decisions related to customer retention and acquisition.
Calculation: Sum of all future revenue from a customer.
Why It Matters?
It helps prioritize customer retention efforts and assess long-term profitability. Focus on retaining customers by offering loyalty rewards or personalized recommendations.
Customer Acquisition Costs (CAC)
CAC calculates how much it costs to acquire a new customer.
CAC = Total Marketing Costs/Number of New Customers Acquired
Balancing CAC with CLV ensures profitable growth.
Compare CAC with CLV. If CAC exceeds CLV, refine your targeting or adjust ad spend.
Example: If you spend $5000 on Facebook ads in a month and acquire 100 new customers, it means that you pay $50 per customer.
Net Promoter Score (NPS)
Measures customer loyalty and satisfaction based on a survey (0-10 scale).
Why It Matters?
Based on customer surveys (0-10 scale), NPS helps you identify loyal fans (promoters) and areas for improvement (detractors).
- Promoters (Score 9-10): They are highly satisfied customers who love your brand. Leverage them to spread positive word-of-mouth by encouraging referrals and reviews.
- Detractors (Score 0-6): They are unhappy and may share negative experiences. Address their concerns promptly to prevent further dissatisfaction and negative word-of-mouth.
Returning Customer Rate
The percentage of customers who make repeat purchases. High returning customer rates indicate brand loyalty and satisfaction.
Returning Customer Rate = Number of Returning Customers/Total Number of Customers×100%
Why it matters?
Loyal customers are the backbone of your business:
- While acquiring new customers is essential, returning customers provide consistent revenue over time. They contribute to your baseline income, especially during lean periods.
- It’s more cost-effective to retain existing customers than to acquire new ones. Loyal customers require less marketing spend and are more likely to refer others.
- A customer who is already making a purchase tends to spend more than originally intended.
- Returning customers become brand advocates. They recommend your products to friends, family, and colleagues, expanding your customer base organically.
- Loyal customers offer valuable feedback. Their insights help you improve products, services, and overall customer experience.
Refund and Return Rate
Monitoring product quality and customer satisfaction. High return rates may indicate issues with products.
Why It Matters?
- High return rates signal potential issues with product quality, functionality, or fulfillment.
- Returns often stem from customer dissatisfaction. Addressing these issues improves overall satisfaction.
- Returns impact your bottom line—processing costs, restocking fees, and potential loss of future sales.
How to investigate:
- Regularly assess product quality. Are there consistent complaints about specific items?
- Update product descriptions. Clear, accurate product descriptions reduce misunderstandings and minimize returns.
- Provide responsive and helpful customer service during the return process.
Churn Rate
The percentage of customers who stop buying from you.
Churn Rate = Number of Lost CustomersTotal Number of Customers×100%
Investigate why customers are leaving. Is it content-related, pricing, or technical issues?
Marketing & User Behavior
Click-Through Rate (CTR)
CTR shows the percentage of visitors who click on a specific link or ad.
CTR = Number of Clicks on Ad/Number of Ad Impressions×100%
Why it matters?
- CTR reveals how well your ad relates to your customers. High CTR suggests compelling ad copy, relevant keywords, and engaging visuals. Customers click because they find value.
- Google Ads rewards high CTR with better Quality Scores, leading to lower costs per click (CPC).
? How to optimize:
- Compare your CTR to industry averages. If you’re below the norm, investigate and optimize.
- Analyze CTR by device (desktop vs. mobile) and location. Tailor strategies accordingly.
- Higher ad positions tend to have better CTR. Aim for the top spots.
- Use sitelink extensions, callouts, and structured snippets to enhance CTR.
- Psychological insights:
- Customers click when they’re curious or intrigued. Craft compelling headlines.
- Emotional triggers (e.g., urgency, excitement) boost CTR.
- Eye-catching visuals draw attention.
- Trustworthy language and clear value propositions encourage clicks.
How to track:
- Google Ads: Monitor CTR in Google Ads. Test different ad variations and keywords.
- Landing Pages: Ensure landing pages match ad promises. High CTR won’t help if visitors bounce.
- A/B Testing: Experiment with ad elements (CTAs, colors, wording) to find what resonates.
Cost Per Click (CPC)
CPC = Total Ad Spend/Number of Clicks
Monitor CPC trends and adjust bids accordingly. Investigate sudden surges to ensure cost-effectiveness.
Example:
A travel agency runs a Google Ads campaign. CPC is $2. If it suddenly spikes to $6, check ad relevance and competition.
Impressions & Reach
Impressions represent the total number of times your content (ads, social media posts) is displayed to visitors.
Reach is the unique count of people who see your content. Think of it as the distinct audience reached.
Why they matter?
- High impressions mean your brand is visible. But quality impressions matter more—reaching relevant audiences.
- More reach means more potential customers exposed to your brand. It widens your funnel.
- Impressions without reach may lead to missed engagement. Reach ensures your content reaches the right eyes.
Engagement
Engagement includes metrics like likes, shares, comments, and time spent on your site.
Why it matters:
- High engagement indicates that visitors find your content valuable or interesting.
- Engaged visitors are more likely to take desired actions—sign up, purchase, or share.
- Analyze which posts generate the most engagement. Replicate successful content strategies.
What to do:
- Segmentation: Analyze impressions, reach, and engagement by demographics (age, location, interests). Tailor content accordingly.
- Ad fatigue: High impressions but low engagement may signal ad fatigue. Rotate ad creatives and refresh content.
- Landing pages: Optimize landing pages for the audience reached. Relevant content reduces bounce rates.
- Psychological impact:
- Impressions: Repetition builds familiarity. Visitors may notice your brand after multiple impressions.
- Engagement: Likes and comments create a sense of social validation. Encourage user-generated content (UGC).
Insight:
- Too many impressions, low engagement: Revisit content quality. Are customers interacting?
- High reach, low engagement: Optimize content relevance and calls-to-action.
Bounce Rate
Bounce rate is the percentage of visitors who leave your site after viewing only one page.
A lower bounce rate suggests better engagement. High bounce rates may indicate irrelevant content, slow loading times, or poor user experience.
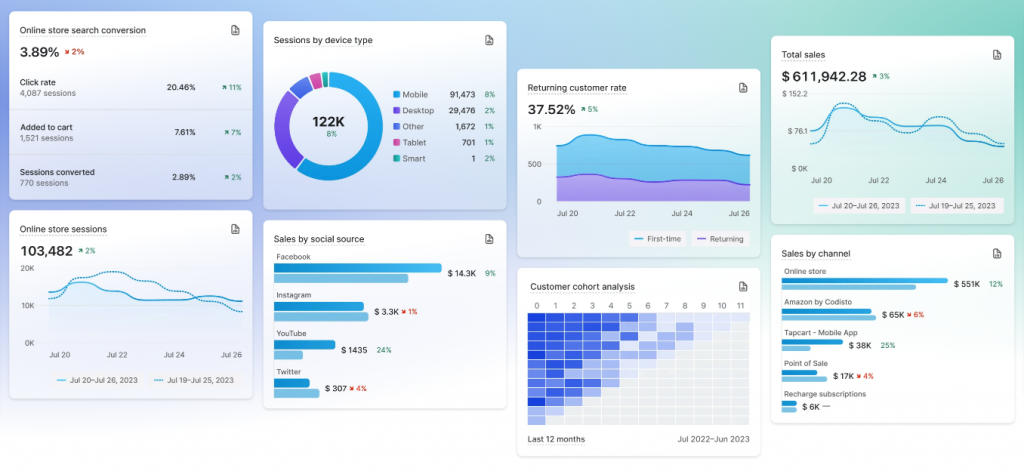
Store Sessions by Traffic Source
Understanding where your traffic comes from (e.g., organic search, social media, paid ads) helps allocate marketing budgets based on the most effective channels.
Store Sessions by Device Type
Analyzing user behavior on different devices (desktop, mobile, tablet) informs responsive design and user experience improvements.
Example: A fashion e-commerce site observes that mobile consumers account for 70% of sessions. Optimize the mobile experience—responsive design, fast loading, and easy navigation.
Store Sessions by Location
Identifying geographic trends helps you to tailor marketing efforts to specific regions’ preferences.
Example: A global tea brand notices high sessions from Japan. They create localized content and promotions for Japanese customers.
Operation & Inventory
Top Products by Units Sold
Knowing which products are popular helps optimize inventory management and marketing strategies.
Example: A pet supply store finds that dog treats consistently top sales.
Promote related products (e.g., dog toys) alongside best-sellers.
Month-End Inventory Snapshot
Helps manage stock levels, and plan for restocking to avoid shortages during peak seasons.
There you have it – the essential metrics that the top e-com businesses obsess over to gain an edge and supercharge their growth.
If you’re using Shopify, their built-in reporting and analytics can help you track most of these metrics effortlessly. ?
From customer lifetime value and acquisition costs to repeat purchase rates and marketing efficiency, these numbers reveal powerful insights far beyond just revenue and orders.
We hope breaking down the importance of each metric, complete with formulas and use cases, helps you implement a more comprehensive measurement strategy.
So roll up your sleeves, dive into your analytics, and start uncovering the untapped potential hidden in these metrics. Consistently monitor and make data-backed decisions based on what you uncover. That’s how you’ll take your e-commerce business to new heights.